Diagnosing and Fixing the 5 Most Common Snowflake Performance Bottlenecks
Slow dashboards, delayed reports, and a surprisingly high monthly bill from Snowflake. Does this sound familiar? You’ve adopted the Snowflake Data Cloud for its power and scalability, but now you’re facing the reality that performance isn’t always automatic. Inefficient queries don’t just frustrate your users; they directly burn through your budget.
At DataCouch, we’ve provided snowflake data cloud consulting and training to global teams, and we’ve seen it all. The good news is that most performance issues stem from a handful of common, fixable problems. The key isn’t just knowing the fixes, but learning how to diagnose the right problem first.
This guide isn’t just another list of tips. It’s a systematic framework, the same one our consultants use, to help you become a performance detective. We’ll teach you how to identify the culprits behind your slow queries and give you the practical steps to solve them, turning your Snowflake environment from a cost centre into a high-performance engine for your business.
Why Snowflake Performance is a Budget Issue, Not Just a Speed Issue
In the world of cloud data warehousing, time is literally money. Unlike traditional on-premise databases with fixed costs, Snowflake’s pay-as-you-go model means every second of compute time on a virtual warehouse adds to your bill. An inefficient query that takes 10 minutes to run when it could have taken 30 seconds doesn’t just waste a user’s time; it wastes your money.
A common misconception, sometimes fueled by marketing messages, is that Snowflake is a “zero-management” platform where performance is entirely automated. While Snowflake’s architecture is brilliant, it’s not magic. According to industry analysis, poorly optimized queries and misconfigured warehouses are among the top reasons for cloud cost overruns in 2024. A single SELECT * query on a large table or an improperly structured join can quickly consume a massive amount of credits, leading to budget shock at the end of the month.
Think of it this way: every optimization you make is a direct saving. By mastering performance tuning, you’re not just making your dashboards load faster; you’re actively managing your cloud spend and improving your company’s bottom line.
The Consultant's Toolkit: How to Find Your Slowest Queries
Before you can fix a problem, you need to find it. Guessing is not a strategy. A consultant’s first step is always to gather data. In Snowflake, your two most powerful diagnostic tools are the QUERY_HISTORY and the Query Profile.
Step 1: Hunt for Problem Queries with QUERY_HISTORY
Your first stop should always be the QUERY_HISTORY view. It’s a log of every query that has run in your account, packed with valuable performance data. You can use a simple SQL query to act like a detective, hunting for the queries that are the biggest resource hogs.
Here’s a practical query you can run right now to find queries from the last week that were either very slow or caused data to spill to disk (a major red flag we’ll discuss later) :
SELECT
query_id,
query_text,
user_name,
warehouse_name,
total_elapsed_time / 1000 AS duration_seconds,
partitions_scanned,
partitions_total,
bytes_spilled_to_remote_storage
FROM
SNOWFLAKE.ACCOUNT_USAGE.QUERY_HISTORY
WHERE
start_time >= DATEADD('day', -7, CURRENT_TIMESTAMP())
AND (
duration_seconds > 60 -- Ran for more than a minute
OR bytes_spilled_to_remote_storage > 0 -- Spilled data to disk
)
ORDER BY
duration_seconds DESC
LIMIT 50;
This list gives you your prime suspects. Once you have a query_id, you can move to the next step: a deep-dive interrogation.
Step 2: Become a Detective with the Query Profile
The Query Profile is Snowflake’s visual explanation of how it executed your query. It’s like a crime scene investigation for your SQL, showing you exactly where the time and resources were spent. If QUERY_HISTORY tells you which query was slow, the Query Profile tells you why.
To access it, go to the History tab in Snowsight, find your query, and click on the Query ID.
When you open a Query Profile, don’t get overwhelmed. Focus on these three clues :
- Most Expensive Nodes: This panel on the right immediately points you to the operations that took the most time. If a TableScan operation is taking 90% of the time, you know the problem is with reading data.
- Partitions Scanned vs. Total: In the TableScan operator details, this is a critical metric. If you see it scanned 9,987 partitions out of 10,000, it means Snowflake had to read almost the entire table. This is a huge sign of inefficient pruning.
- Bytes Spilled to Storage: Look for any non-zero value for “Bytes spilled to local storage” or, even worse, “Bytes spilled to remote storage.” This tells you the query ran out of memory, which is a major performance killer.
With these tools, you’re no longer guessing. You’re diagnosing. Now, let’s look at the five most common culprits you’ll uncover.
The 5 Common Culprits: Diagnosing and Fixing Performance Bottlenecks
After analyzing thousands of queries, we’ve found that most performance problems fall into one of these five categories.
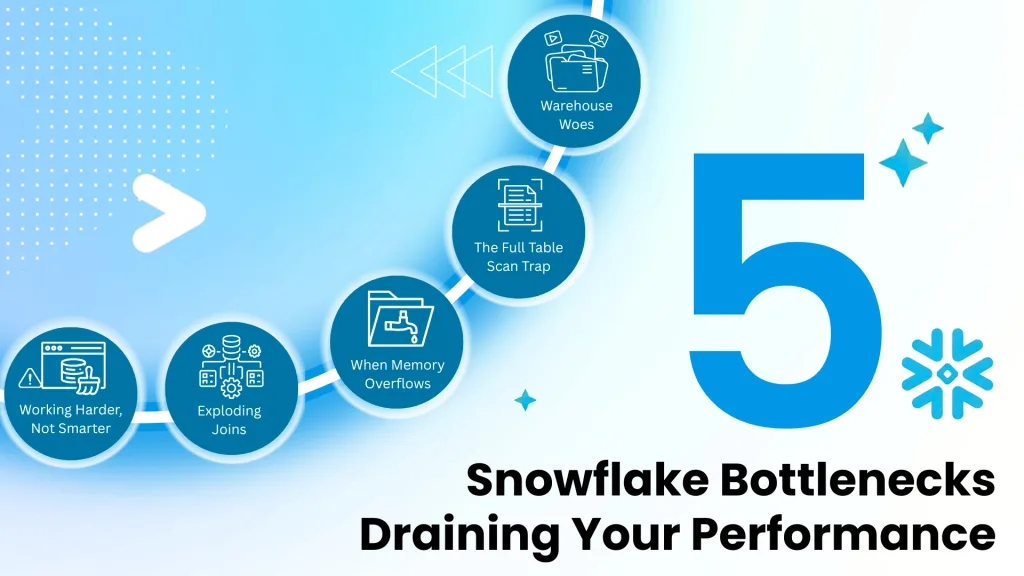
Bottleneck #1: Warehouse Woes (Resource Contention & Queuing)
The Problem: Your virtual warehouse is like a highway. When too many cars (queries) try to get on at once, you get a traffic jam. In Snowflake, this is called queuing. Queries get stuck waiting for resources to become available, leading to delays. This often happens when many users or BI dashboards hit the same warehouse simultaneously.
How to Diagnose It:
- In the Query History page in Snowsight, you’ll see queries with a “Queued” status.
- The Warehouse monitoring page will show a high “Queued Load” over time.
How to Fix It:
- Scale Out with Multi-Cluster Warehouses: This is the best solution for high concurrency. Instead of making the highway wider (scaling up), you add more lanes that automatically open and close as traffic increases. This allows Snowflake to handle bursts of queries without queuing.
- Right-Size Your Warehouse: If a single, complex query is slow, you might need to scale up to a larger warehouse size (e.g., from a Medium to a Large). But be careful with this approach.
- Adjust Concurrency: You can fine-tune the MAX_CONCURRENCY_LEVEL parameter. Lowering it gives more resources to fewer queries, which can help complex operations, while increasing it allows more queries to run at once.
Why Simply Making Your Warehouse Bigger is Often the Worst Thing You Can Do
A common knee-jerk reaction to a slow query is to just increase the warehouse size. While this can sometimes be the answer (especially for memory-intensive tasks), it’s often a costly mistake. Over-relying on larger warehouses can mask underlying problems like inefficient SQL or poor table structure. You end up paying more for compute when a simple query rewrite could have solved the problem for free. Always diagnose the query first before scaling up your warehouse.
Bottleneck #2: The Full Table Scan Trap (Inefficient Data I/O & Pruning)
The Problem: Snowflake stores data in tiny, compressed blocks called micro-partitions. When you run a query with a WHERE clause (e.g., WHERE order_date = ‘2024-09-07’), Snowflake is smart enough to only scan the micro-partitions that could possibly contain that date. This is called pruning, and it’s the secret to Snowflake’s speed. A full table scan happens when pruning fails, forcing Snowflake to read every single micro-partition in your table—a huge waste of time and resources.
How to Diagnose It:
- In the Query Profile, look at a TableScan operator. If the “Partitions scanned” is very close to “Partitions total,” you have a pruning problem.
How to Fix It:
- Implement Data Clustering: This is the most powerful solution. By defining a cluster key on a large table (e.g., on a date or customer ID column), you tell Snowflake to physically sort the data in storage. This makes pruning incredibly efficient. When you filter on the cluster key, Snowflake can skip the vast majority of partitions.
SQL
— Apply a cluster key to an existing large table
ALTER TABLE large_fact_table CLUSTER BY (event_timestamp, customer_id);
- Write Pruning-Friendly Queries: Avoid using functions on your filtered columns. For example, WHERE YEAR(order_date) = 2024 will likely disable pruning. Instead, write WHERE order_date >= ‘2024-01-01’ AND order_date < ‘2025-01-01’, which allows Snowflake to use the micro-partition metadata effectively.
Bottleneck #3: When Memory Overflows (Disk Spillage)
The Problem: Some operations, like sorting a huge dataset (ORDER BY) or complex joins, require a lot of memory. If the operation needs more memory than the virtual warehouse has available, Snowflake will “spill” the excess data to the warehouse’s local disk, or even worse, to remote cloud storage. Spilling to remote storage is often called the “#1 performance killer” because disk I/O is dramatically slower than processing in memory.
How to Diagnose It:
- The Query Profile makes this obvious. You will see a non-zero value for “Bytes spilled to remote storage” on one of the query operators. Any remote spillage is a major problem that needs to be fixed.
How to Fix It:
- Optimize the Query First: Before increasing warehouse size, try to reduce the query’s memory footprint. Can you filter the data earlier in the query? Are you using SELECT * when you only need a few columns? Simplifying the query to process less data is the most cost-effective solution.
- Increase Warehouse Size: If the query is already optimized and still spills, it’s a legitimate candidate for a larger warehouse. A bigger warehouse comes with more memory, which can allow the operation to complete without spilling.
Bottleneck #4: Why Your Simple Join is Creating a Billion Rows (Exploding Joins)
The Problem: An “exploding join” happens when your join logic is flawed, causing the number of rows to multiply unexpectedly. This is often due to a missing or incorrect join condition, or joining on columns that are not unique, resulting in an unintentional Cartesian product. This can quickly overwhelm the warehouse and consume massive amounts of credits.
How to Diagnose It:
- The Query Profile provides a clear visual clue. Look at the arrows connecting the operators in the query plan. If you see the row count jump from 100k on one side of a join to 100M on the other, you’ve found an exploding join.
How to Fix It:
- Correct the Join Logic: This is the fundamental fix. Meticulously review your ON clause to ensure you are joining on the correct keys and that the relationship between the tables is what you expect.
- Use DISTINCT or GROUP BY: If your join is correctly creating duplicate rows that you don’t need, you can use DISTINCT to remove them or aggregate the results with a GROUP BY clause.
- Break It Down with CTEs: For very complex logic, use Common Table Expressions (CTEs) to break the query into logical, sequential steps. This improves readability and can help you isolate where the row explosion is happening.
Bottleneck #5: Working Harder, Not Smarter (Ignoring Caching & Materialized Views)
The Problem: Many performance issues aren’t caused by a single bad query, but by running the same expensive query over and over again. This is common with BI dashboards that are refreshed by multiple users. You’re paying to re-compute the same result repeatedly, which is incredibly inefficient.
How to Diagnose It:
- This is less about a single query profile and more about recognizing patterns. Look at your QUERY_HISTORY for identical or very similar query text being run frequently by different users or applications.
How to Fix It:
- Embrace the Result Cache: Snowflake automatically caches the results of every query for 24 hours. If the exact same query is submitted again, Snowflake returns the result instantly without using any compute credits. To maximize your chances of a cache hit, standardize your queries. Even a change in whitespace can cause a cache miss.
Use Materialized Views Strategically: For queries that are run frequently but with slight variations (e.g., summarizing sales for the last 7 days), a Materialized View is a perfect solution. It pre-computes and stores the result of the query. When users query the view, they get a near-instant response. This is one of the most powerful tools for accelerating dashboards and common analytical queries.
Proactive Performance Management: Staying Ahead of the Slowdown
Fixing slow queries is great, but preventing them is even better. A proactive approach to performance management will save you time, money, and headaches in the long run.
Set Up Guardrails with Resource Monitors
Resource Monitors are your financial safety net in Snowflake. They don’t speed up queries, but they can prevent a runaway query from blowing your budget. You can set credit quotas for warehouses and define actions—like sending an alert or automatically suspending the warehouse—when usage thresholds are met. This is a must-have for any cost-conscious organization.
Make Performance a Team Habit
Encourage a culture of performance awareness in your data team.
- Regular Reviews: Make looking at the top 10 most expensive queries from QUERY_HISTORY a weekly or monthly ritual.
- Code Reviews: Include a performance check in your SQL code review process. Does the query use appropriate filters? Does it avoid SELECT *?
- Educate: Share this guide and other resources to help your team understand the impact of their queries.
Comparison Table: Which Solution for Which Bottleneck?
Here’s a quick reference table to help you connect the symptom to the right solution.
| Bottleneck | Key Diagnostic Indicator (in Query Profile)s | Primary Solution(s) |
|---|---|---|
| 1. Warehouse Contentiong | High "Queued" time in Query History | Scale out with a Multi-Cluster Warehouse |
| 2. Inefficient Pruning | "Partitions Scanned" is close to "Partitions Total" | Implement Data Clustering on large tables |
| 3. Disk Spillage | Non-zero "Bytes Spilled to Remote Storage" | Optimize the query to reduce memory usage; then scale up warehouse if needed |
| 4. Exploding Joins | Massive increase in row count after a Join operator | Correct the SQL join logic; ensure join keys are unique |
| 5. Ignoring Caching | Identical queries running repeatedly in Query History | Standardize queries to leverage the Result Cache; use Materialized Views |
Meet Us at the Snowflake World Tour 2025
Theory is great, but seeing innovation in action is even better. That’s why the DataCouch team is excited to be part of the Snowflake World Tour, a global event series designed to showcase the future of AI and apps.
The tour is a fantastic opportunity to immerse yourself in real-world strategies, connect with data leaders, and experience the latest capabilities across the full data lifecycle—from a secure, scalable platform to smarter analytics and enterprise-ready AI.
We believe in the power of community and sharing knowledge, and we’ll be at all the India events. Come and meet us!
- Delhi: Aug 30, 2025 – We had a great time attending and connecting with so many of you!
- Hyderabad: Sep 10, 2025 – Our team will be attending. Let’s connect!
- Bangalore: Sep 26, 2025 – Visit our booth! DataCouch will have a dedicated booth in Bangalore. This is a perfect chance to have in-depth conversations with our experts, discuss your specific challenges, and explore new possibilities for your data strategy.
And We're Going Global: See Us at GITEX GLOBAL 2025 in Dubai!
Our commitment to driving the future of data and AI doesn’t stop in India. This year, DataCouch is thrilled to announce that we will be setting up a booth at GITEX GLOBAL 2025, the world’s largest tech and AI show, in Dubai from October 13-17!
This is a massive opportunity to connect with global leaders and innovators, and we want to meet you there. Visit our booth to discuss how we can partner to drive your business forward. We are especially keen to connect with:
- SMEs: Looking for expert consulting and a roadmap for AI transformation.
- Tech Product Companies: Seeking partnerships for enablement and L&D extension.
- Universities: Aiming for AI-enablement to prepare the next generation of talent.
- CXOs, VPs, and GMs: In need of coaching and change management strategies for the new Agentic AI era.
- Businesses: Requiring customized AI solutions to solve unique challenges.
Come find us at GITEX GLOBAL to explore the future of technology and create new possibilities together.
The DataCouch Takeaway: Which Strategy is Best for You in 2025?
The single most important takeaway is this: diagnose before you optimize. Don’t just guess. Use the powerful tools Snowflake provides—QUERY_HISTORY and the Query Profile—to find the true root cause of a performance problem. A systematic, data-driven approach will always outperform random tweaking.
Mastering these techniques can transform your Snowflake usage, but it can also be complex. If you’re looking to empower your team with expert-led training or need hands-on snowflake data cloud consulting to tackle your toughest performance challenges, DataCouch is here to help. Our global experts have helped Fortune 500 companies optimize their data platforms, and we can do the same for you.
Contact us today to learn more about our corporate training programs and consulting services.


