Why Tableau Alone Is Dying in the AI Era
We live in a strange time for the corporate world. Walk into any boardroom or log into a strategy session. You will see data everywhere. We built pipelines to move massive amounts of information. We hired armies of analysts. We bought expensive licenses for tools like Tableau and Power BI. By all measures, we should be the most informed leaders in history.
Data analytics is shifting from passive dashboard viewing to active, AI-driven decision-making. This change renders standalone visualization tools insufficient for the speed and complexity of modern business needs. This shift is powered by Agentic AI, artificial intelligence systems that do not just visualize data but reason through problems and execute business tasks autonomously.
Here’s the surprising truth: We are not.
A silent crisis is unfolding behind the glossy charts. It is a crisis of utility. Recent industry reports show that marketing teams use 230% more data today than they did just a few years ago. You might assume that triple the data leads to triple the clarity.
What most people don’t realize is that the opposite has happened. Instead of clarity, we have confusion. Instead of speed, we have paralysis.
According to Supermetrics, 56% of marketers say they do not have enough time to analyze their data properly. They are overwhelmed. They stare at screens full of numbers but lack the time to find the “why” behind the “what.” And if they’re able to figure out the “why” somehow, then the next big question that stares them in the face is “so what?” This is the defining challenge of our time. At the center of this storm sits the traditional dashboard.
For over a decade, the dashboard was the gold standard. But relying on Tableau alone in the age of Artificial Intelligence is risky. It is like trying to play 3D chess with the rule book of a 2D chess from 1999. It shows you the streets. However, it does not tell you about traffic or drive the car for you.
We are moving to a world where AI acts on data. This shift is existential. It affects your technology stack, your cloud budget, and your people.
In this blog, we will dismantle the current state of Data Analytics. We will expose the hidden costs of “Zombie Dashboards” and explain why “Agentic AI” is the only viable path forward. We will also outline exactly how Corporate Training can save your team from obsolescence.
Is data overload paralyzing your team's decision-making? DataCouch's expert-led training helps analysts cut through the noise and find insights faster.
What Is a Zombie Dashboard and Why Does It Kill Value?
To understand the failure of the old model, we must look at the lifecycle of a typical dashboard. It starts with high energy. A Vice President asks why sales dropped in the Northeast region.
The data team scrambles. They pull data from Snowflake. They clean it. They load it into Tableau. They spend a week designing a beautiful interface with complex filters. They present it to the VP. The VP is impressed.
For the first week, the VP checks the dashboard every morning.
By the third week, they check it once.
By the second month, they stop checking it entirely.
Business moves on. The VP has a new question. But the dashboard is static. It cannot answer the new question.
The "Set It and Forget It" Trap
The VP stopped looking at the dashboard. However, the dashboard did not stop working.
This is what we call a Zombie Dashboard. It is “dead” in value but “alive” in costs. Most modern dashboards use automated query schedules. Every morning at 6:00 AM, that dashboard wakes up. It sends a complex SQL query to your cloud data warehouse. It crunches millions of rows of data. It refreshes its cache.
It does this whether anyone is looking or not.
In the cloud era, every second of computing costs money. When you have one zombie dashboard, it is a nuisance. When you have hundreds, it is a financial hemorrhage.
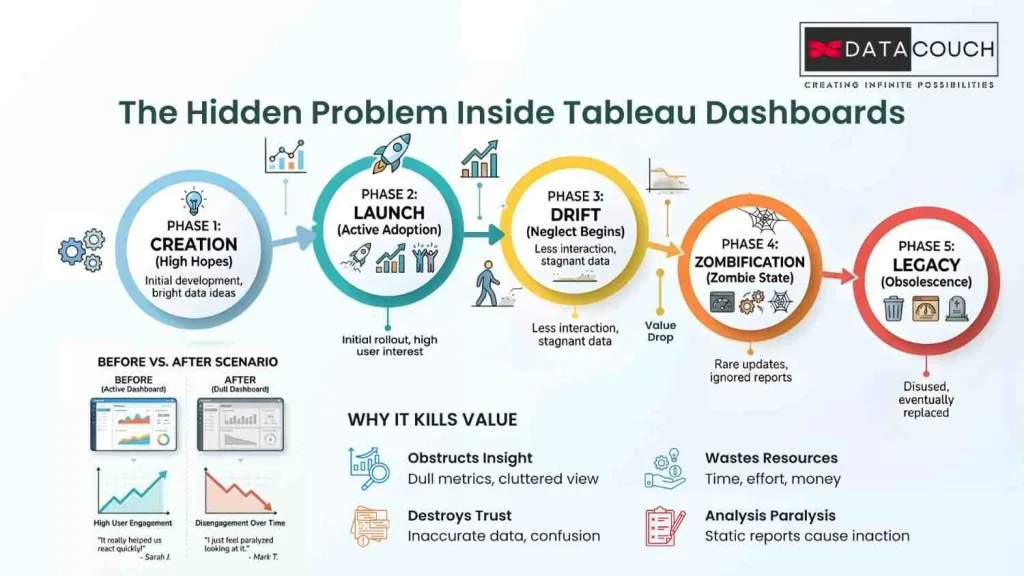
The Lifecycle of a Zombie Dashboard
| Stage | Activity | Cost Implication | Value Generated |
|---|---|---|---|
| Phase 1: Creation | The analyst spends 40 hours building the view. | High (Labor cost) | High (Potential) |
| Phase 2: Launch | The executive reviews it during planning. | Low (Compute cost) | High (Immediate Insight) |
| Phase 3: Drift | Business logic changes. Dashboard stays static. | Low (Compute cost) | Declining |
| Phase 4: Zombification | Users stop visiting. Refresh remains active. | Continuous (Cloud Bill) | Zero |
| Phase 5: Legacy | "Don't touch it. The CFO might need it." | Cumulative Waste | Negative |
The Psychological Safety Blanket
Why do we keep them?
Managers feel safer knowing the data is “there” even if they do not look at it. Deleting a dashboard feels risky. IT teams are paralyzed. They fear someone might complain.
This accumulation of “digital clutter” leads to Dashboard Rot. Users lose trust in the analytics portal because they cannot tell which reports are current. When users lose trust, they stop using the platform. They revert to gut feelings or offline spreadsheets.
Industry statistics paint a grim picture. Forrester estimates suggest that up to 73% of enterprise data goes unused for analytics. We pay to store it. We pay to process it. We pay to visualize it. And then we ignore it.
Why Is the ".twb" File Architecture a Roadblock for AI?
The functional issues of dashboards are bad. The technical issues are arguably worse. To understand why Tableau alone cannot survive in the AI era, we need to look at the file structure.
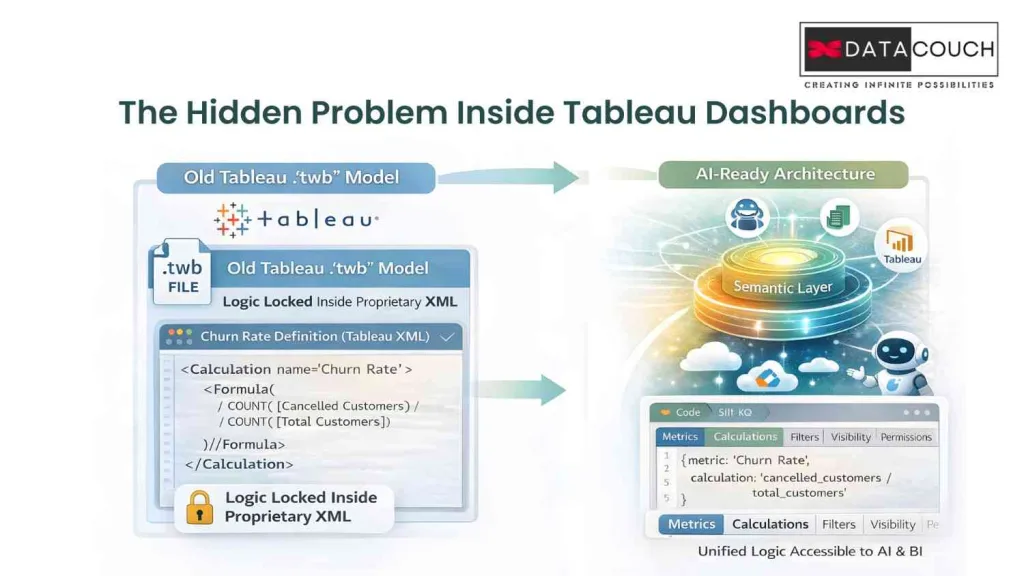
When an analyst builds a report in Tableau, they create a file with a .twb extension. If you open that file with a text editor, you see thousands of lines of XML.
This XML file is the DNA of your dashboard. It contains visual instructions and connection details. Crucially, it contains Business Logic.
The Logic Lock-In
In the “Tableau Alone” model, the definition of your most important business metrics lives inside the visualization tool. This is a disaster for scalability.
Imagine you have a metric called “Churn Rate.”
- Analyst A builds a dashboard for Sales. They define Churn Rate in Tableau as (Cancelled Customers / Total Customers).
- Analyst B builds a dashboard for Marketing. They define Churn Rate in their Tableau file as (Cancelled Customers / (Total Customers + New Signups)).
When the CEO asks for the Churn Rate, she gets two different numbers. This is the “Tower of Babel” effect.
Because the logic is locked inside the .twb file, it is sealed. You cannot easily share that logic with other tools. You cannot simply “import” the Churn Rate definition from the Sales dashboard into the Marketing dashboard.
What most people don’t realize is that this architecture makes it impossible to implement AI effectively.
Why Can't AI Simply Read Dashboards?
This “logic lock-in” is the primary barrier to AI adoption.
If you want to build an AI agent to answer questions about revenue, that AI needs to know the definition of “Revenue.”
If “Revenue” is defined inside a .twb XML file, the AI cannot read it. The AI cannot “see” inside the proprietary file format of your dashboard tool.
So the AI has to guess. It looks at the raw database tables. It sees a column called sales_amt. It assumes that is revenue. But it does not know about the filters you applied in Tableau to exclude “Internal Test Accounts.”
The result is Hallucination. The AI gives you a number that looks right but is mathematically wrong.
This is why DataCouch advises clients that you cannot simply “turn on” AI. You have to re-architect your data. You have to move the logic out of the dashboard.
How Much Money Is Your Legacy Dashboard Strategy Wasting?
We touched on the cost of Zombie Dashboards earlier. The financial implications go much deeper. The “Tableau Alone” model is often financially inefficient in a modern cloud environment.
The FinOps Wake-Up Call
This is where FinOps comes in. FinOps brings financial accountability to the variable spend model of the cloud.
In a rigid dashboard environment, FinOps is difficult. It is hard to see which specific metrics drive costs. The query log just says “Tableau Query.” It does not tell you which chart on the dashboard caused the spike.
Companies that implement rigorous FinOps practices and optimize their analytics layer report an average 30% reduction in cloud costs.
For a large enterprise, 30% is a massive number. It is enough to fund your entire AI transformation program. But you cannot unlock these savings if your analytics are trapped in a black box of proprietary dashboards.
Is your team stuck maintaining legacy dashboards instead of building AI capabilities? DataCouch provides the expert-led training needed to transform your analysts into AI-ready engineers.
What Is a Semantic Layer, and Why Does Your AI Need It?
If Tableau is fading as a standalone solution, what’s taking its place? Not another visualization tool. The real shift is a restructure of where intelligence lives. Tableau doesn’t go away, it just stops being the brain and becomes one of many consumers that read from governed, trusted metrics.
We are moving to an architecture known as Headless BI or the Semantic Layer.
How Does Headless BI Work?
In the old world, the BI tool did everything. It connected to the database, modeled the metrics, and visualized the results.
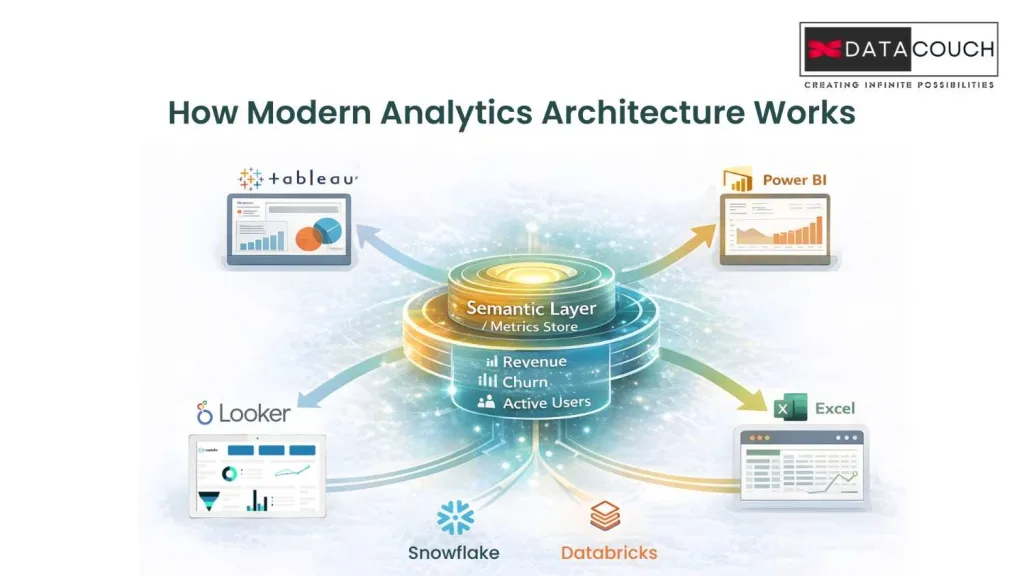
In the new world, we separate the “Brain” from the “Face.”
- The Semantic Layer (The Brain): This is a centralized server where you define your metrics once. You write the code that says exactly how to calculate Gross Margin.
- The Consumption Layer (The Face): This is where you see the data. It could be Tableau. It could be Power BI. It could be an AI Agent.
Monolithic BI vs. Headless BI Architecture
| Feature | Traditional BI (Tableau Monolith) | Headless BI (Semantic Layer) |
|---|---|---|
| Logic Location | Locked inside .twb files. | Centralized in code (Git). |
| Consistency | Low (Metrics drift across reports). | High (Define once, use everywhere). |
| Maintenance | Nightmare (Update 50 files manually). (maturing) | Easy (Update code once, all tools update). |
| AI Readiness | Zero (AI cannot access logic). | High (AI queries the Semantic API). |
| Flexibility | Vendor Lock-in. | Agnostic (Swap viz tools easily). |
Is This the "Universal Truth" for AI?
This architecture solves the metric inconsistency problem. When the CEO asks for “Gross Margin,” the request goes to the Semantic Layer. The Semantic Layer calculates it using the single approved definition. It sends the same number to Tableau and to the AI bot.
This is the foundation of Data Analytics in the AI era. Without a Semantic Layer, your AI is just guessing. With it, your AI is grounded in truth.
How Does Agentic AI Move Analytics from Observation to Action?
If the Semantic Layer is the brain, Agentic AI is the hands. This is the most exciting development in the field.
What Are the Limitations of "Looking"?
Dashboards are passive. They tell you what happened. They say “Inventory is low.”
But knowing is only half the battle. You still have to do something. In the traditional workflow, a human sees the alert. They interpret it. They log into another system. They take action. This introduces delays.
What Makes AI "Agentic"?
Agentic AI refers to AI systems that can reason, plan, and execute actions. They do not just show you a chart. They fix the problem.
Imagine an AI Agent monitoring your supply chain.
- Detection: The Agent notices a shipment of raw materials is delayed.
- Reasoning: It checks your inventory levels. It calculates that you will run out of material in 3 days.
- Planning: It queries the Semantic Layer to find alternative suppliers.
- Action: It drafts a purchase order for the best supplier. It sends a message to the Procurement Manager asking for approval.
Is This the New Workflow?
In this scenario, the dashboard is irrelevant. The manager did not need to look at a chart. The Agent handled the analysis and presented a decision.
This shifts the role of the human from Operator to Supervisor.
The Workflow Shift
| Step | Traditional Analytics (Dashboard) | Agentic Analytics (AI) |
|---|---|---|
| Trigger | Human checks dashboard (maybe). | Agent monitors data 24/7. |
| Analysis | Humans drill down to find the root cause. | Agent correlates data instantly. |
| Decision | Humans formulate a plan. | Agent proposes options based on logic. |
| Action | Human logs into ERP to type orders. | Agent executes via API upon approval. |
| Time to Value | Hours or Days. | Minutes. |
Is the "Tableau Developer" Role Facing Extinction?
This technological tsunami is creating a massive ripple effect in the job market. For the last ten years, “Tableau Developer” was a safe job.
Here’s the hard truth: That role, as it exists today, is facing structural decline.
As AI takes over the visualization layer and the Semantic Layer takes over the business logic, the need for someone to manually drag charts is vanishing.
Why Is the Analytics Engineer Rising?
The value is moving upstream. The new hero of the data team is the Analytics Engineer.
An Analytics Engineer is a hybrid professional. They understand data analysis. But they apply Software Engineering practices to it.
They do not just build charts. They build the Semantic Layer. They write the code that defines the metrics. They use Git for version control. They write automated tests to ensure the data is accurate before it reaches the dashboard or the AI Agent.
The Skills Gap
| Skill | "Tableau Developer" (Declining) | "Analytics Engineer" (Rising) |
|---|---|---|
| Primary Tool | Tableau Desktop / Power BI | dbt / SQL / Python |
| Focus | Visual Aesthetics | Data Quality, Semantic Modeling |
| Code | Proprietary Calculated Fields | SQL, Python (Open Standard) |
| Version Control | None (Save as v2.twb) | Git/GitHub |
| Output | Dashboards | Trusted Datasets & API Endpoints |
Is Your Team Facing a Crisis of Competence?
Most organizations have teams full of Tableau Developers. Your current team is likely very good at visualizing data. However, they may be uncomfortable with command-line tools, coding, and version control.
If you try to implement a modern AI stack with a legacy team, you will fail. Your team will struggle to maintain the Semantic Layer. They will revert to old habits. They will build “Zombie Dashboards” because that is what they know.
How Can Corporate Training Prepare Your Team for 2026?
The smartest path forward is Corporate Training. Your existing employees possess something that AI and new hires do not. They possess Institutional Knowledge.
They know why the data looks the way it does. They know the history of the company. This context is invaluable. If you can teach them the new tools, they will be far more effective than a new hire who knows the tools but does not know the business.
What Is the "Team Training" Mandate?
Effective team training in this era is not about watching videos. It is about hands-on practice.
- Virtual Labs: Teams need safe environments where they can break things. They need to practice using Git. They need to practice defining metrics in code.
- Reskilling Tracks: You need a structured path to take a “GUI-first” analyst and turn them into a “Code-first” engineer.
- Tool Agnosticism: Training should focus on the principles of Data Modeling rather than just which button to click.
“AI will not take your job. Someone trained on it will.”
This is the essence of the moment. The goal of AI is not to replace humans. It is to elevate the human. By removing the drudgery of manual reporting, your team is freed to work on high-value problems.
What Actionable Steps Should Leaders Take?
If you are a manager or CTO, here is your roadmap.
- Audit Your Dashboard Estate: Run a usage report. Identify the “Zombies.” Be brave enough to delete them.
- Decouple Your Logic: Start a project to move critical business logic out of .twb files and into a centralized Semantic Layer.
- Pilot Agentic AI: Pick one specific use case and build an agent to handle it. Do not try to boil the ocean.
- Invest in Training: Do not assume your team will “pick it up.” Provide structured Corporate Training on Python, SQL, and AI concepts.
Are You Ready to Choose the Right Path at the Fork in the Road?
We are standing at a crossroads.
Down one path lies the Status Quo. It is the path of “Tableau Alone.” It feels comfortable. But it leads to a graveyard of unused dashboards and spiraling cloud costs. It leads to AI projects that fail due to hallucinations.
Down the other path lies the Modern Intelligence Architecture. It is a world where Semantic Layers provide a single source of truth. Agentic AI executes actions instantly. Analytics Engineers build robust code.
The technology to take the second path exists today. The only variable left is your willingness to adapt.
This is not just about installing new software. It is about upgrading your organizational mindset. It is about recognizing that the “dashboard” was a bridge and not a destination.
Are you ready to take the next step toward solving this challenge?
At DataCouch, we specialize in guiding enterprises through this exact transformation. Whether you need high-level consulting to architect your Semantic Layer or deep-dive team training to upskill your workforce, we help you bridge the gap.
Don’t let your data strategy die on a static screen. Future-proof your business today.


